top of page
How to read your daily blood glucose patterns/ AGP
(Ambulatory Glucose Profile)

An easy guide to understanding your CGM (continuous glucose monitor) results.
Your AGP shows your blood sugar patterns so you can take care of your health.

Are your numbers in target range?
Are there low blood glucose trends?
Are there high blood glucose trends?
Is there glucose variability?
Pick 1 thing to work on

What is an AGP?
The Ambulatory Glucose Profile (AGP) shows your blood glucose readings over the last 7, 14, 30, or 90 days.
We suggest using the 7-day AGP to review weekly.

Dark Line
The dark line shows the median, or the middle number, of all the sensor readings at that time of day. Half of the numbers are above this line and the other half are below this line.

The Dark Blue “River”
The dark blue part, which looks like
a river, shows where your blood sugar is half (50%) of the time.

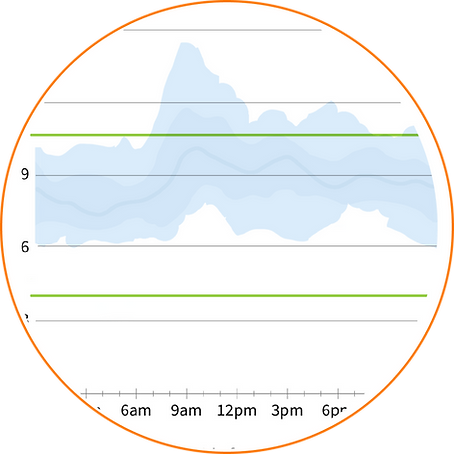
The Light Blue/
Grey Band
The lighter blue or grey area shows where your blood sugar is almost all (90%) of the time.


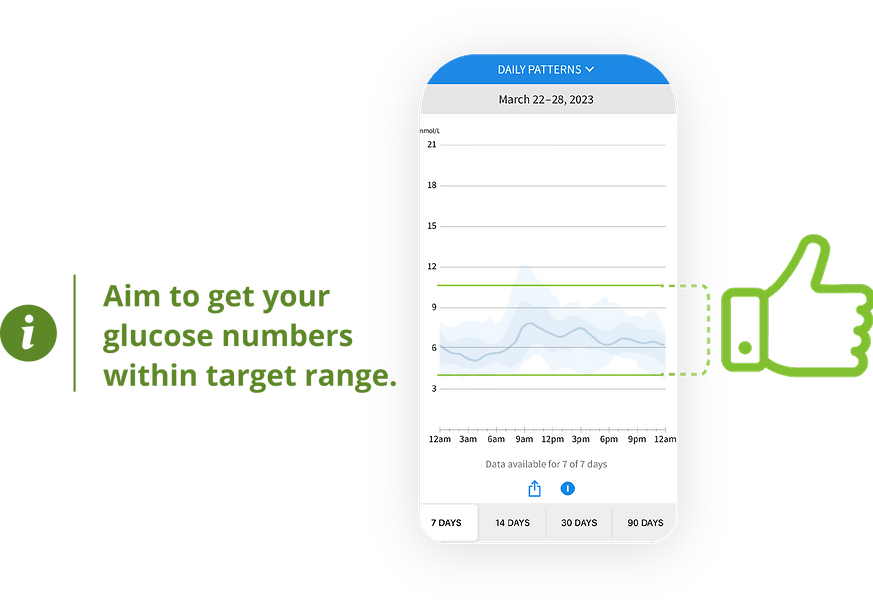
Step 1
Are your numbers within target range?
Most people with diabetes should aim to keep blood glucose between 3.9-10mmol/L more than 70% of the time.

Step 2
Are there low blood glucose trends?
The first goal is to get rid of any low blood glucose (aka hypoglycemia) patterns.
What is causing the blood glucose to drop?
-
Medication dose or timing?
-
Physical activity?
-
Skipped meals?
-
Alcohol?
-
Hormones? (Menses, menopause)
-
Or something else?
How can you prevent low blood glucose?


Step 3
Are there high blood glucose trends?
What is causing the highs?
-
Missed medications?
-
Specific foods?
-
Portion size?
-
Physical activity?
-
Stress?
-
Illness?
-
Treating hypoglycemia?
How can you prevent high glucose?
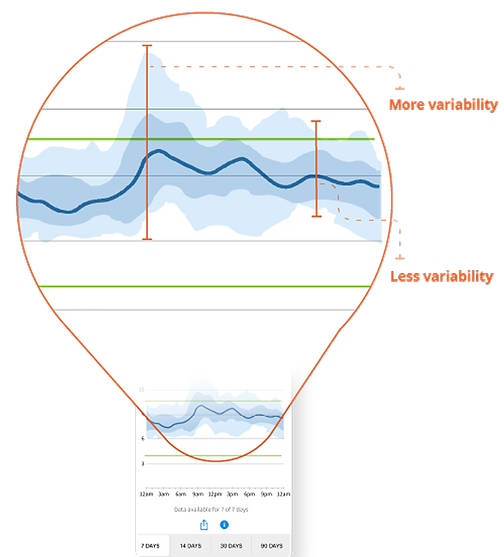
Step 4
Is there glucose variability?
What is causing the variability?
More variability on your AGP means your blood glucose changes a lot from day to day. Look for the widest part of the blue shaded area.
-
Different types of foods on different days?
-
Changing medication dosage or timing?
-
Different kinds/levels/timing of physical activity?
-
Stress?
-
Hormones?
-
Other-e.g. Work schedule?
The goal is less variability
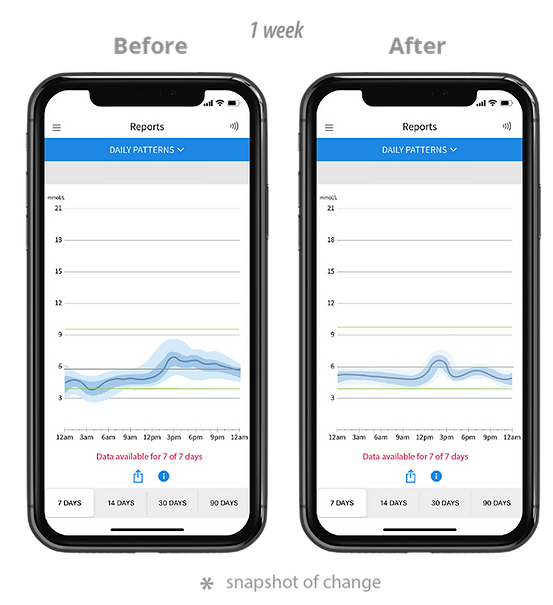
Step 5
Pick 1 thing to work on for a week
Take a screenshot of your 7-day AGP this week and compare it to next week. Did your week go as you planned?
Make it a habit!
-
Reviewing your AGP every week can help you make the most of your CGM.
-
Make small changes that you can maintain, to build confidence and slowly get your blood sugars more in target.
If you are having trouble reaching your targets, please contact your health care provider.
PLP Disclaimer
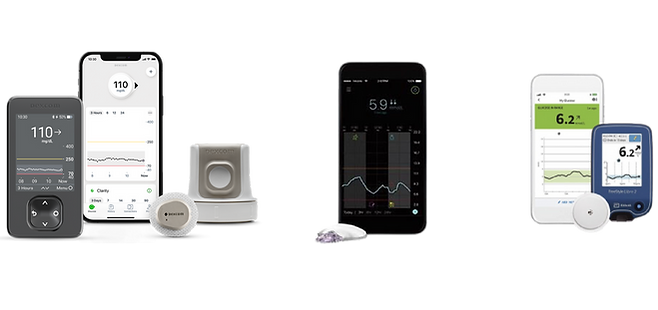
As of December, 2024, common CGM sensors in Canada include devices made by Abbott Laboratories (Libre 2 and Libre 3+), Dexcom (G6 and G7), and Medtronic (Guardian). Images shown are based on the libre App, but this guide also applies to Dexcom Clarity and other CGM apps. The Physician Learning Program does not endorse any single sensor manufacturer or device.

bottom of page